


Silver Up, Treasuries Down
It may be time to turn a little near-term cautious on silver
Dear subscriber,
We recently got some signals of a potential rate cut from the Fed. A recent GDP revision from the US Department of Commerce said the economy grew at 1.3% in Q1, versus the 1.6% estimated a month earlier.
That’s well below the 3.4% of Q3. Bond yields fell, and their prices rose on renewed expectations that the Fed would cut rates starting in September.
The April update for the Fed’s preferred inflation indicator, the personal consumption expenditure (PCE) index, was down slightly from the prior month.
Low- and middle-income consumers are spending less at big name discount retailers and using their credit cards more. And US jobless claims have show signs of weakening employment.
If you need any reason or motivation for seeking out alternative wealth protection, this chart is about as compelling as you’ll ever get.
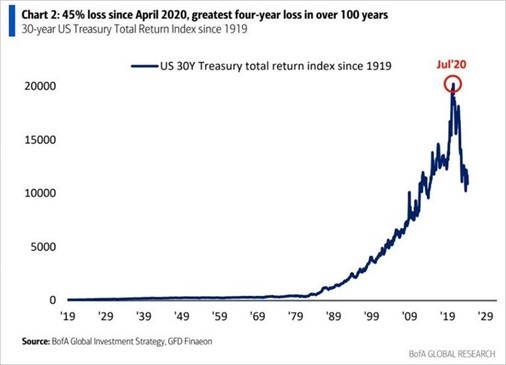
Think about what it’s telling us.
In more than 100 years, there has not been a worse 4-year period for 30-year Treasuries. If you’re holding those, they are down an astounding 45% since April 2020.
So much for government bonds being a safe haven.
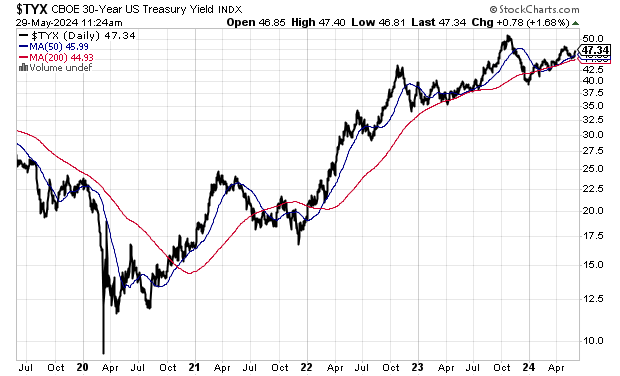
It’s all about interest rates.
You see the yield on 30-year bonds has soared, which means they’ve been increasingly discounted by the market as the Fed has increased rates.
For comparison, here’s what happened to gold and silver just as the 30-year bond started to crash.
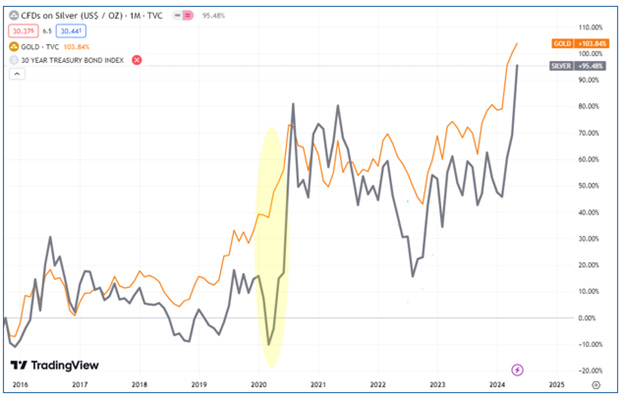
Both metals began to soar in early 2020, months before the 30-year Treasury peaked, and have just started a new leg up.
Since early 2020, silver is up 140%. Meanwhile, the total return on 30-Year Treasuries is down 45%, their worst 4-year period in more than 100 years.
We have to listen to the markets. They tell us what to expect, and where to be invested.
I believe we are in a new era of inflation that I call the inflation decade. And I fully expect gold and silver to perform exceedingly well. The action of the last three months is confirming that.
China, which knows how to play the long game perhaps better than anyone, is making it clear.
Their holdings of US Treasuries are down 40% in the last decade.
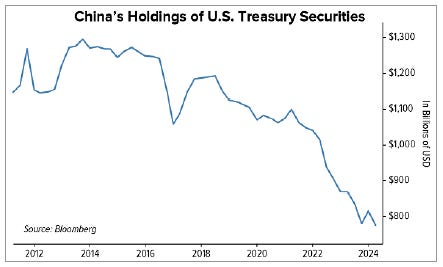
Meanwhile, their gold reserves have taken off, up 17% in the last year alone. And that’s just the official numbers. Many astute observers are convinced that Chinese gold holdings are vastly underreported.
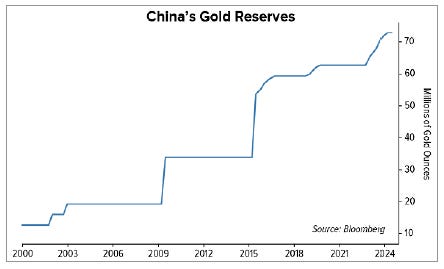
If you assume, as I do, that they continue to accumulate gold (and silver), then underreporting is a smart tactic to allow buying on the cheap before announcing their true holdings.
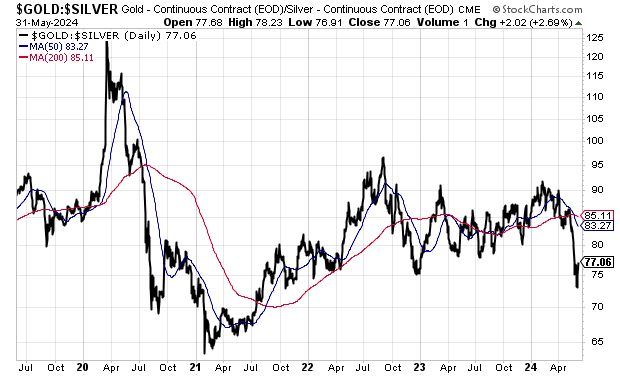
And if we look at the recent relationship between gold and silver through the gold/silver ratio, we see that it has clearly broken down below the key level of 80. This is something I’ve said repeatedly is something to watch, as both metals tend to do well as the ratio falls, while silver outperforms.
In this issue I look at this along with other technical price charts for the US dollar index, silver and silver stocks. I provide a deep dive review of one of my favourite junior silver developers whose flagship project has the best near-term prospect of returning to high-grade silver and gold production from a fully permitted mine. And finally, I provide updates on all news for our portfolio holdings.
I’m excited for the next weeks, months and years in silver and silver stocks.
The overarching thesis in my book The Great Silver Bull is playing out.
By reading it, you get the big picture view of the opportunity and how to seize it. (For real-time assessment of the silver sector and ongoing developments and opportunities, this newsletter www.silverstockinvestor.com is the answer).
If you haven’t picked up a copy of the book yet, it’s easy.
CLICK HERE to order The Great Silver Bull
I do think that now is a time to turn a little cautious. With silver up about 45% in the last three months, a retracement or consolidation would be totally normal over the next couple of months. But on a tactical basis, I’d expect that weakness to be an opportunity.
Peter Krauth
Publisher, www.silverstockinvestor.com